A test plan to characterize elastomer (rubber) fatigue and failure typically looks like this:
Basic Hyperelastic Characterization
Uniaxial tension test
Planar tension (pure shear test)
Equal biaxial extension test
Volumetric compression (Bulk Modulus) test
Tensile test to failure
Static tearing test
Fatigue crack growth measurements
Elastomeric materials in engineering applications experience complicated strains and stresses. They are expected to carry loads, dissipate energy, and seal gaps. Sometimes they fail and that, too, is complicated.
Mechanical fatigue and failure in elastomers is about starting and growing cracks. Some stresses in a part can cause a crack to grow; depending on the direction of a stress, it might actually close the crack and not cause it to grow.
However, mechanical failure in elastomers is nearly always a crack growing event. Even in a simple tension test, at some point while stretching the elastomer, a tiny flaw somewhere in the specimen reaches a critical energy and rips across the specimen until it breaks into 2 separate pieces. The crack could be an unintentional defect or inherent to the material morphology.
To predict mechanical failure and fatigue in elastomeric parts, one may study how cracks start and grow in elastomeric materials under various loadings and temperatures. We look at the stress needed to rupture a specimen, the stress needed to start an existing crack growing, the energy needed to grow cracks during cycling, the energy needed to resist cutting, the time needed to grow cracks under constant stress, and the number of cycles needed to initiate crack growth.
Tensile Test to Failure
One would reasonably expect a tensile test to provide very useful failure information, but while the failure data is useful, it may not be sufficient.
Two different elastomers may exhibit the same strain value at failure in a tensile test, yet in the presence of a tiny sharp cut, one material may fail at a strain one-tenth of the other. Some elastomers are very durable in the presence of cuts and some are not. For some elastomers, failure strain results show a large variability between tensile test repetitions. Some believe this is related to the statistical variability in crack initiation sites within a material specimen.
Data From a Tensile Test to Failure
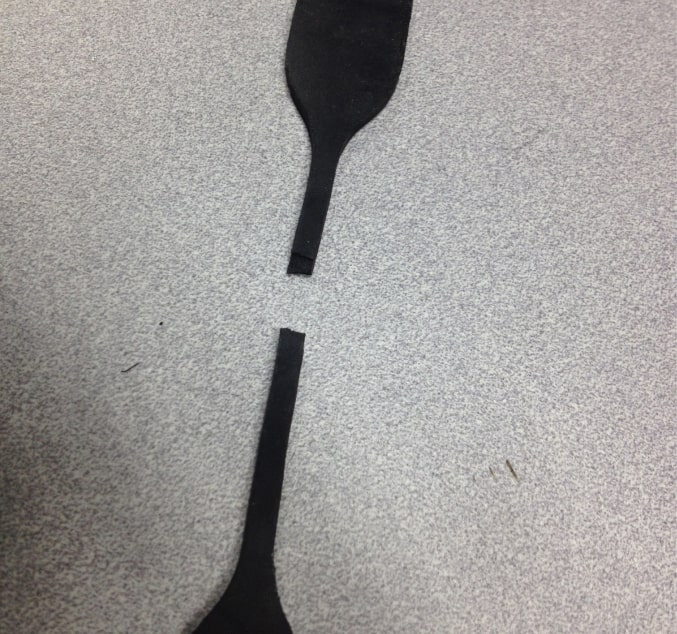
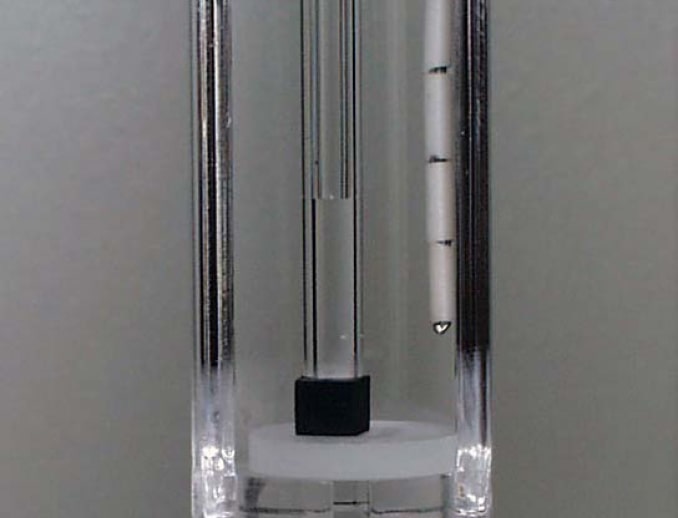
Failed Tensile Specimen with a Typical Fracture Surface
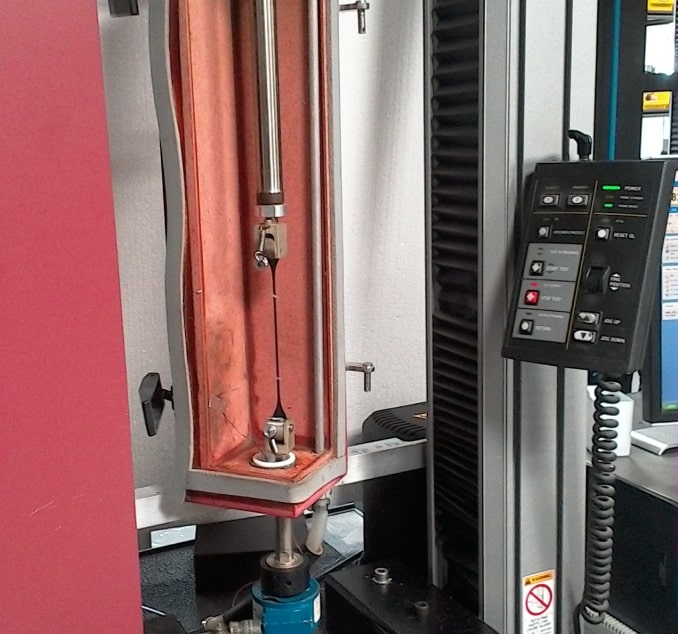
A Tensile Test in Action with Laser Tags
Tear Strength
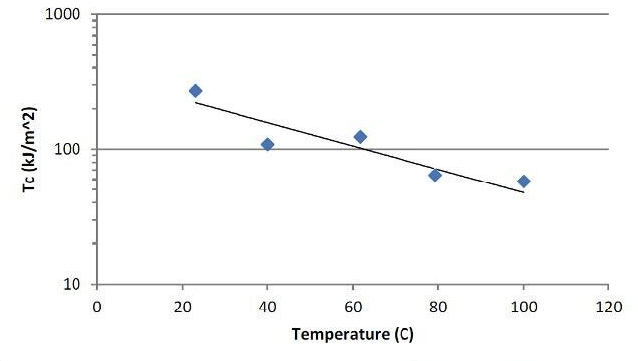
Since the dominant mechanism of mechanical failure in elastomers is the growth of cracks, it makes sense to subject a material to the worst-case direction of crack growing and simply pull open an existing cut. This is the tear strength, or tearing energy test. Unlike some of the ISO and ASTM tests that are similar, this experiment is best performed by adding a very sharp cut into a material and pulling in a Mode I direction. The stress, strain, and energy at which the crack grows provide very useful design limits for engineering design and analysis. From this experiment, a critical tearing energy, Tc, may be calculated.
In this experiment, a cut is made in a planar tension test specimen and stretched until the crack grows. This experiment is often performed at multiple temperatures.
Tearing Energy is Determined From the Area Under the Stress-Strain Curve
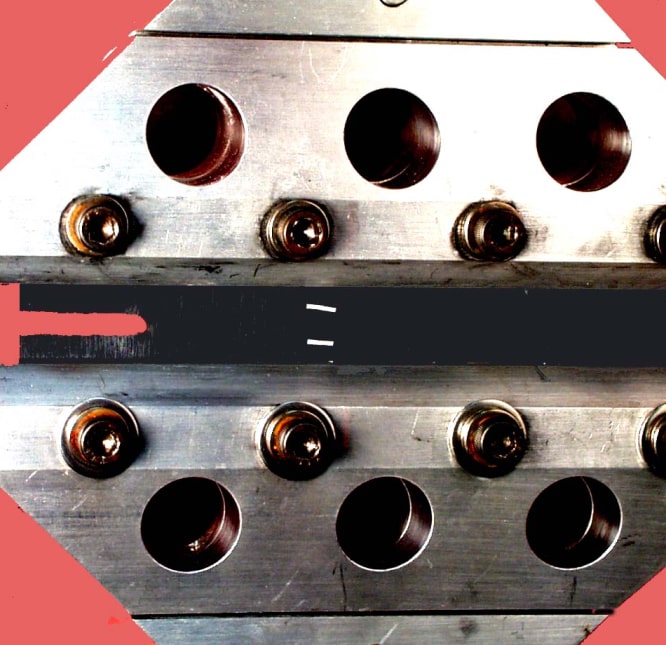
Planar Tension Specimen with a Pre-Cut Crack in Tension
Fatigue Experiments
In plastics and metals, basic strain-life (S-N) curves are often used effectively to predict part fatigue. “S-N” curves are generated by cycling tensile specimens to failure. This approach isn’t as straightforward for elastomers for several reasons:
Elastomers are typically used at large strains and they generate viscoelastic heat during straining. To avoid significantly changing the temperature of the test specimen during testing, elastomeric cyclic tests are typically run at 1 Hz or slower. This results in a lengthy test and time on test instruments is costly.
“S-N” tests inherently exhibit high scatter due to the variation in the material’s initial crack size. The variation for some materials can be frustrating and requires more replicates to overcome.
Each experiment, which can take days or weeks, is only one point on an “S-N” curve.
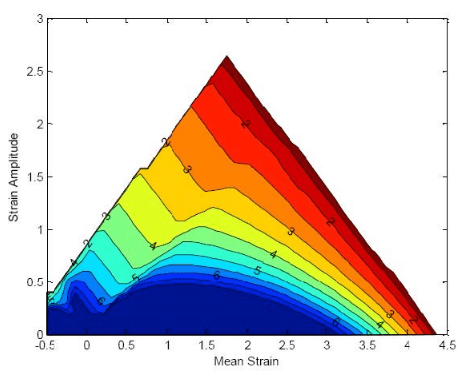
Some elastomers exhibit an effect called “strain crystallizing.” This effect makes the material very minimum-strain sensitive. An elastomer that fully unloads to zero strain during cycling will fail much faster than when the minimum strain is not unloaded to zero strain. This effect, which can be very significant in some materials, is typically not captured with “S-N” data sets.
It isn’t enough to focus on maximum stresses to find failure locations; the critical question with elastomers is, “Will this stress in this direction open a crack?”
In summary, generating elastomeric strain-life fatigue data sets is time consuming and can be frustrating.
Fatigue Crack Growth Experiments
The purpose of the fatigue crack growth experiment is to measure the rate at which a pre-cut crack grows during cyclic loading. The main idea here is that if we know the starting crack size and we know how fast cracks grow, we can predict part failure.
There are many ways to design a crack growth experiment, and at Axel Products we perform them under many conditions. For simplicity, a common approach is described herein: A pure shear (planar tension) test specimen is selected because the strain state at the crack tip stays the same as the crack grows and the calculation of crack tip energy is simple.
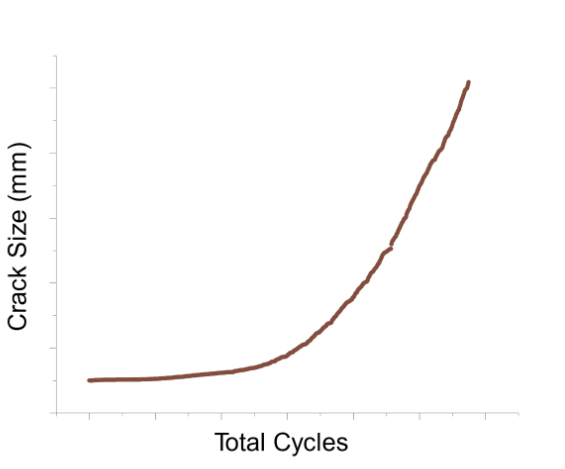
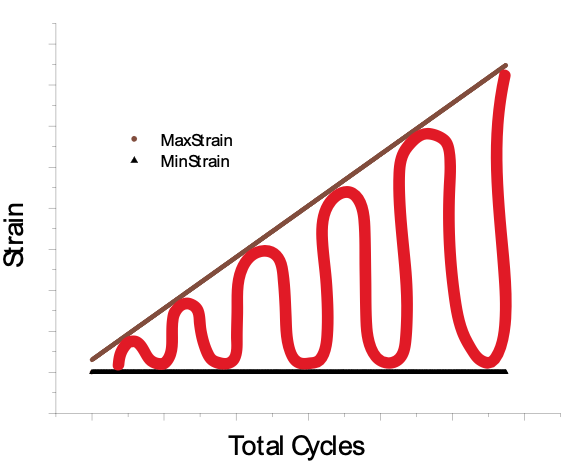
A cut is placed in the specimen far from the edge to avoid edge effects. The specimen is stretched in a loading-unloading pattern such that the minimum strain is zero and the maximum strain slowly increases over 20 hours. Throughout the entire duration of theexperiment, the width of the crack is measured.
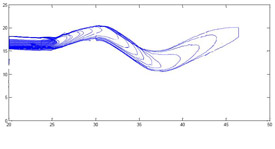
At some point, the crack begins to grow. Since the maximum strain is slowly increasing, the rate at which the crack grows will also increase. The slope of the crack length plotted against cycles is the crack growth rate.
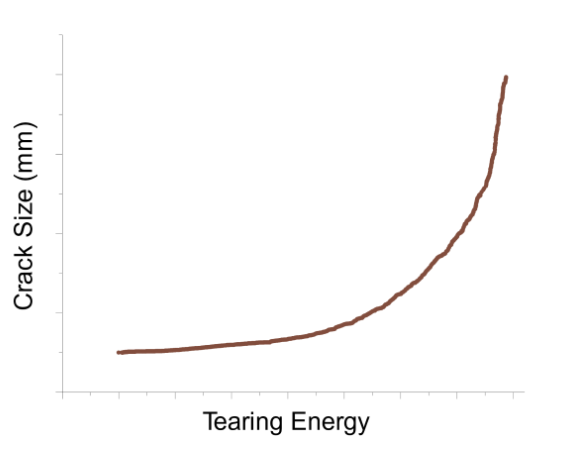
In addition to measuring the crack width, corresponding times, strain, and stress are measured and associated energy calculations are made.
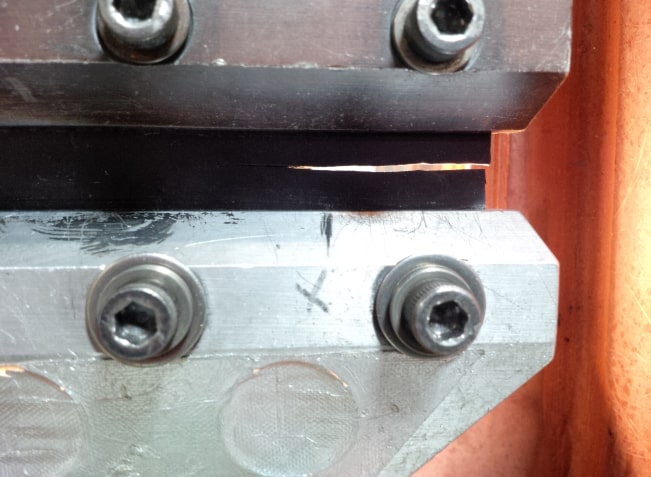
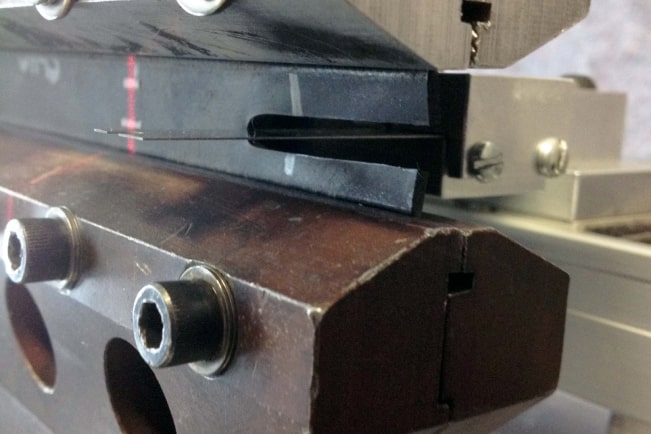
A Pre-Cut Crack in a Fatigue Crack Growth Instrument
The Winding Path a Crack Might Take
A Graph of Crack Size with Increasing Maximum Strain
The Same Experiment Showing a Crack Increasing with Increasing Tearing Energy
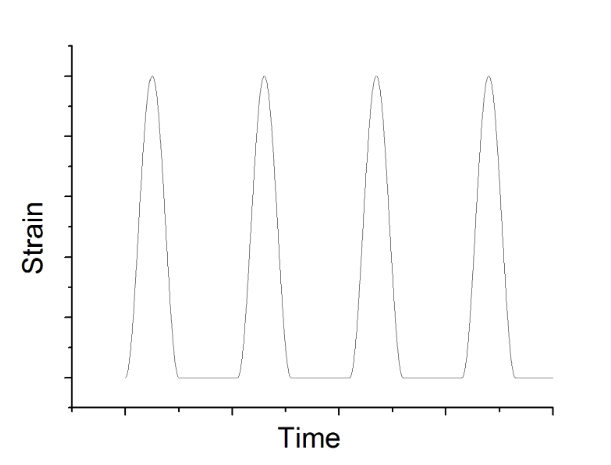
A Schematic of the Increasing Strain Wave Shape
Fatigue Crack Growth Experiments, Non-relaxing
As previously mentioned, some elastomers are also very minimum-strain sensitive. This means elastomers that are cycled between a given maximum strain and zero strain may have a much shorter fatigue life than the same elastomer cycled between that identical maximum strain and a small positive minimum strain. As such, the effects of the ratio of minimum strain to maximum strain may be significant.
A well-intentioned analyst could re-design a part to minimize the maximum strains but in doing so cause the material to undergo strain reversals that result in much more fatigue damage and, therefore, a shorter fatigue life.
Crack growth experiments can be designed to capture this effect. These tests are referred to as “non-relaxing” in the elastomer fatigue community. The basic idea is to increase the maximum strain during cycling to a set maximum strain or crack growth rate, hold at this rate for a short time, and finally increase the minimum strain until the crack growth decreases to zero. This sequence is typically repeated at 3 different crack growth rates.
Crack Growth Stops for Some Material When the Minimum Strain is Increased
Rubber Haigh Diagram
Fatigue Crack Growth, Wave-shapes, and Frequency
Fatigue crack growth rates are somewhat sensitive to the type of loading.
A sine wave input may have a slightly different result than a pulse-dwell wave-shape. Some experienced analysts use very specific wave-shapes. For example, tire manufacturers might use a dwell pulse timed similarly to the loading of a tire patch strain history on a highway. Machine mount manufacturers may prefer a low frequency sine wave.
Strain Pulse Waveshape for Crack Growth Fatigue
Creep Crack Growth Experiments
When a load is carried over a long period, a crack in an elastomeric material may grow, even if the load is smaller than the static tearing strength (TC) and even in the absence of dynamic cycles. The rate of crack growth under these circumstances is governed by the instantaneous value of the energy release rate. The growth of a pre-cut crack in an elastomer specimen is observed under a constant or very slowly increasing strain. The creep crack growth may occur at smaller stresses and strains than expected. Valuable information may be obtained in experiments lasting less than a day.
The loading conditions, strain levels and straining rates should also be developed considering the inter-relationship between tests.
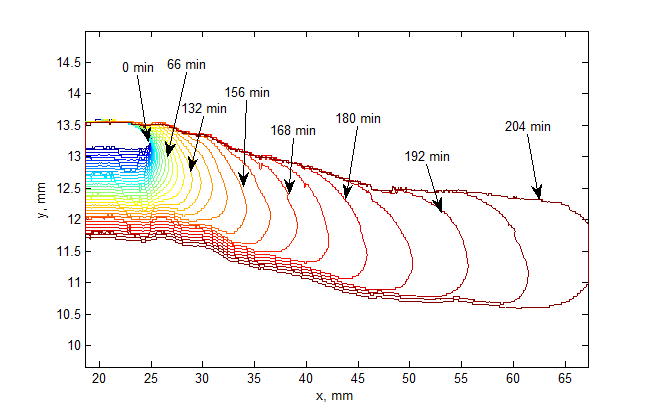
Crack Contour Progression Over Time
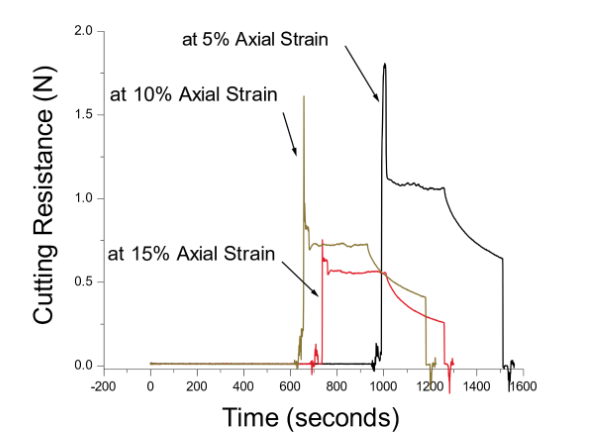
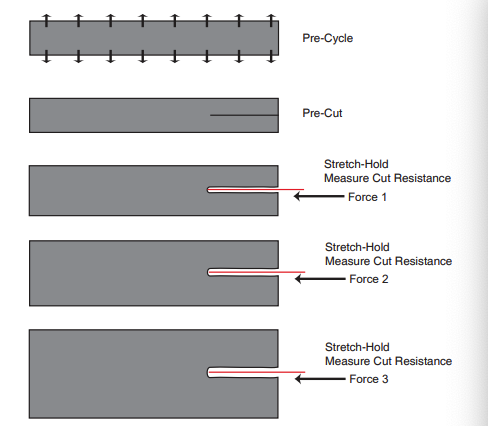
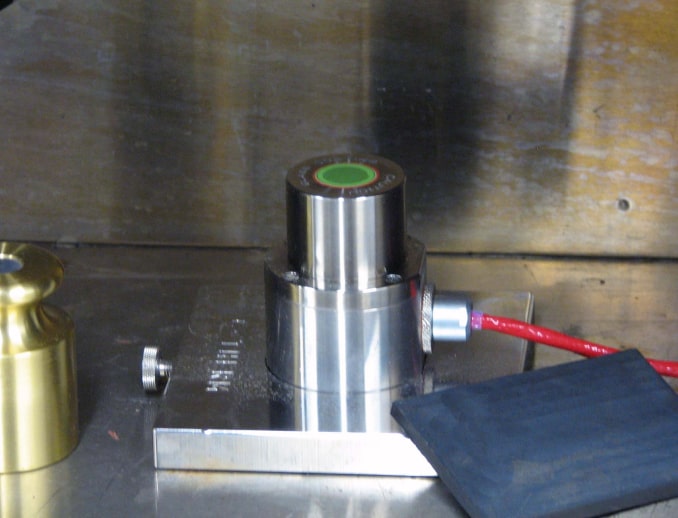
Cutting Resistance Experiments
Cutting resistance is measured by applying a sharp blade against pre-strained elastomer specimens while observing the force required to cut.
The cutting resistance forces can be used directly to evaluate materials. The resulting data may also be used as part of an intrinsic energy calculation. The experiment is a modern version of the experiment performed by G. J. Lake and O. H. Yeoh referenced in the International Journal ofFracture 14, 509 (1978). The experiment was rediscovered by Will Mars of Endurica in recent years.
An Instrumented Sharp Blade Cutting an Elastomer
Cutting Resistance vs Time Plots
The Cutting Resistance Experiment Sequence
Temperature
All things related to mechanical failure in elastomers are temperature sensitive; some more than others.
Tests at 23°C may not reliably predict performance at 80°C. It is critical to take measurements at the temperature of interest.
Furthermore, elastomers are often hysteretic and have low thermal conductivity which means that cyclic loading will cause the internal temperature of elastomeric parts to increase significantly. Hotter elastomers fail faster.
Critical Tearing Energy Decrease with Increasing Temperature